
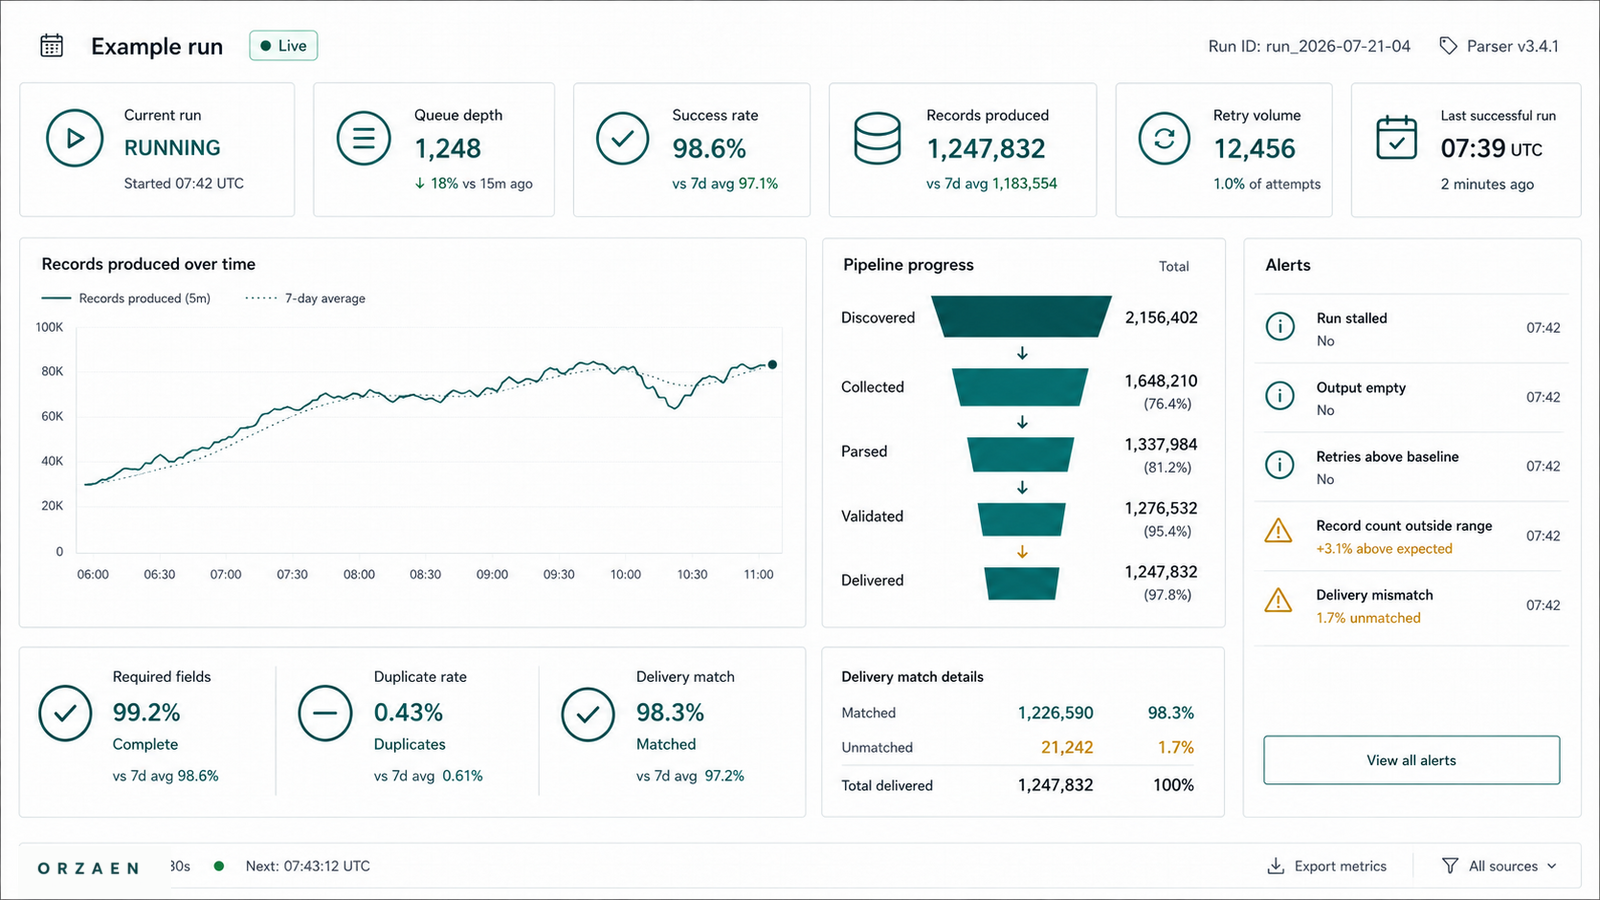
Short answer
Web-scraping monitoring must answer more than “Did the process run?” A production system should track crawl progress, valid-response rates, retry and block classes, parser output, field coverage, record distributions, queue reconciliation, freshness, and final delivery. Alerts should identify the affected source and likely failure layer rather than send one generic error after the dataset is already incomplete.
A scraper can exit successfully while collecting bad or partial data. Data signals therefore belong beside infrastructure signals.
Monitoring and change detection are different
These topics overlap but own different questions.
| Discipline | Main question | Examples |
|---|---|---|
| Pipeline monitoring | Is the complete collection run healthy and on track? | Queue progress, latency, retries, field coverage, delivery counts |
| Website change detection | Did a source response, template, or data contract drift? | Selector failures, response signature changes, new JSON shape |
Monitoring observes the entire run. Change detection is one diagnostic layer inside it. Read How to Detect Website Changes Before a Scraper Silently Loses Data for sentinel pages, fixtures, parser versions, and source drift.
The six monitoring layers
| Layer | What to measure | What it catches |
|---|---|---|
| Scheduler and workers | Run starts, heartbeats, worker count, memory, CPU | Jobs that never start or stop unexpectedly |
| Network and source | Status classes, latency, response signatures, bytes | Rate limits, source outages, session failure |
| Crawl frontier | Planned, pending, active, completed, failed tasks | Stalls, lost work, runaway discovery |
| Parser and schema | Parsed records, required fields, exceptions, schema versions | Selector and payload changes |
| Dataset quality | Unique records, null rates, distributions, duplicates, freshness | Silent incomplete or implausible data |
| Delivery | Export count, checksum, location, consumer acknowledgement | Correct database but wrong or missing file |
No single dashboard number can summarize all six layers.
Give every run a durable identity
Create a run record before collection starts.
Useful fields include:
run_id- Source and configuration version
- Parser and schema version
- Start time and intended collection window
- Expected segments or task estimate
- Input file or query identity
- Environment and deployment version
- Run status
- Completion time
- Delivery artifact references
Every task, response, parsed record, exception, and delivery should be traceable to that run. Without this identity, comparing logs with output becomes manual guesswork.
Use structured logs
A useful log event has stable fields, not only a sentence.
{
  "event": "task_retry_scheduled",
  "run_id": "2026-07-22-source-a",
  "source": "source-a",
  "task_type": "detail",
  "task_key": "profile:123",
  "attempt": 2,
  "failure_class": "http_429",
  "next_attempt_at": "2026-07-22T13:30:00Z"
}
Keep sensitive values, credentials, full cookies, and personal data out of logs. Store response references or hashes instead of dumping every body into an operational log stream.
Useful event types include:
- Run started, paused, resumed, completed, or failed
- Task discovered, claimed, completed, retried, excluded, or exhausted
- Session created, refreshed, expired, or quarantined
- Response accepted or rejected by signature
- Parser version applied
- Schema or validation failure
- Delivery created, verified, and acknowledged
Measure the crawl frontier
The queue or crawl frontier is the clearest progress source.
Track:
- Planned segments
- URLs or identifiers discovered
- Pending tasks
- Active tasks
- Completed tasks
- Tasks waiting for retry
- Terminal failures
- Explicit exclusions
- Duplicate task keys rejected
- Discovery rate and completion rate
A progress percentage is only meaningful when the denominator is known. If discovery is still expanding the queue, show that uncertainty instead of reporting a misleading completion figure.
The pagination patterns guide explains how segment and page state create that denominator.
Monitor source and request health
Group request metrics by source, endpoint, method, task type, and response class.
Measure:
- Valid-response rate
2xx,3xx,4xx, and5xxresponses403and429separately- Timeouts and connection failures
- Median and high-percentile latency
- Response size and content-type changes
- Redirect destination changes
- Retry attempts per completed task
- Session refresh and route health
Do not place raw URLs, record IDs, or high-cardinality task keys in every metric label. Keep those in logs or traces. Metrics work best with stable, bounded dimensions.
Use the 403, 429, and temporary-failure guide to classify these signals.
Monitor parser and field output
Network success does not prove parser success.
For each source and record type, track:
- Responses accepted for parsing
- Records emitted
- Parser exceptions
- Required fields present
- Null rate by important field
- Data type and format failures
- Unknown enum or category values
- Records sent to an exception table
- Parser and schema version
Compare the current field coverage with a recent healthy baseline. Alert on important changes, but preserve room for normal source variation.
For example, a phone number may be optional across the dataset but historically present in 85–90% of one source. A sudden fall to 3% deserves review even if the parser never raises an exception.
Monitor dataset-level quality
Track the final dataset as a population.
Useful signals include:
- Unique record count
- Duplicate rate by duplicate type
- Required-field coverage
- Min, max, median, and distribution for numeric fields
- Category and geography distributions
- Added, changed, missing, and unchanged records versus the previous snapshot
- Source URL and collection timestamp coverage
- Freshness
- Referential integrity between related tables
The scraped-data validation guide explains how structural, semantic, coverage, and reconciliation checks become acceptance criteria.
Monitor the delivery itself
Many systems stop monitoring after rows enter a database. The buyer may receive a CSV, Excel workbook, JSON file, API table, or database handoff, so the exported artifact also needs checks.
Validate:
- File or table exists
- Export completed after the final accepted record
- Row counts match the delivery manifest
- Headers and column order match the contract
- Encoding and delimiters are correct
- Large spreadsheets were split intentionally when required
- Checksums or sizes were recorded
- The consumer can access the artifact
- Failed and exception records were included or reported as agreed
The success state should be “delivery verified,” not merely “crawler process exited.”
Build a run reconciliation equation
Every planned task should reach a terminal, explainable state.
planned or discovered tasks
= completed
 + failed terminal
 + excluded
 + deferred with reason
For record delivery:
discovered source identities
= accepted records
 + duplicate relationships
 + invalid or exception records
 + missing detail tasks
The exact equation depends on the source, but unexplained differences should block or qualify delivery.
Create source-specific baselines
One threshold for every source creates noise.
Baseline by:
- Source and record type
- Day of week or collection window where relevant
- Query or geographic segment
- Full crawl versus incremental refresh
- Parser version
- Known seasonal or catalog changes
Use both absolute and relative thresholds. A 50% record drop is important, but so is the loss of a required field across 200 records when the total count stays stable.
Alerts should be actionable
A useful alert answers:
- Which run and source are affected?
- Which layer failed?
- When did the condition begin?
- What current and baseline values triggered it?
- How many tasks or records are affected?
- Is collection paused, continuing, or exhausted?
- Where is a representative log or raw-response reference?
- What is the immediate operator decision?
Examples:
- “Source A detail valid-response rate fell from 98% baseline to 42% over 15 minutes; 1,260 tasks waiting; circuit open.”
- “Source B required
pricecoverage fell from 96% to 4% after parser version 17; delivery blocked.” - “Run C has discovered no new URLs for 30 minutes while 18 planned segments remain unvisited.”
Avoid alerting on every individual retry. Aggregate normal recoverable events and alert when their rate, duration, or backlog crosses an operational boundary.
Keep dashboards separated by decision
One overcrowded dashboard is hard to use. Separate views for:
Run operations
Current runs, worker health, queue progress, failure backlogs, and estimated completion.
Source health
Valid responses, status classes, latency, sessions, proxy routes, and response signatures.
Data quality
Record counts, required-field coverage, duplicates, distributions, and snapshot changes.
Delivery
Artifacts, manifests, checksums, delivery status, and outstanding exceptions.
Each view should link to the underlying run and source details.
What Orzaen's published work illustrates
Orzaen's Kramp crawler and GraphQL result reports separate counts for HTML pages, GraphQL responses, and validated URLs. That separation matters: requests, discovered identities, and accepted dataset units are different measurements.
The Instagram 400K enrichment result also highlights batching, retries, and input-order preservation. For enrichment jobs, reconciliation must prove that every input was matched to an output or exception without changing the consumer's expected order.
Common monitoring mistakes
Monitoring only process uptime
A healthy worker can repeatedly parse zero records. Monitor data output and coverage.
Alerting only on zero rows
Partial loss is often more dangerous because it looks plausible. Track field and segment baselines.
Using high-cardinality metric labels
Putting every URL or record ID in metric dimensions creates expensive, unusable monitoring. Keep detailed identities in structured logs.
Comparing every run with one global average
Different sources and query segments have different normal ranges. Use source-aware baselines.
Ignoring final export checks
A correct database does not prove the delivered CSV or workbook is complete and readable.
Frequently asked questions
What is the most important web-scraping metric?
There is no single metric. Valid unique records reconciled against an explicit expected set is more meaningful than raw request success, but it must be paired with remaining failed, excluded, and deferred tasks.
How can I detect a scraper that returns bad data without crashing?
Monitor required-field coverage, distributions, record counts, response signatures, duplicate rates, and source-specific baselines. Preserve representative raw responses and parser versions so the change can be diagnosed.
Should every retry create an alert?
No. Temporary retries are normal. Alert when retry rates, exhausted tasks, backlogs, or source-wide failures cross a threshold, or when data quality is at risk.
How often should data-quality checks run?
Run cheap checks continuously or per batch, and run complete reconciliation before delivery. The cadence should be fast enough to stop a bad parser from processing an entire source unnoticed.
What should happen when monitoring finds incomplete data?
Pause or qualify the affected delivery, preserve the bad-run evidence, isolate the source or parser version, reprocess from raw responses when possible, and reconcile the corrected output before release.
Next step
Build monitoring around the complete scalable web-scraping pipeline, then connect it to website change detection and crawl resumption. If a recurring collection system needs observability and recovery designed together, review Orzaen's Web Scraping & Data Extraction service.
Sources
- OpenTelemetry logs data model (opens in a new tab)
- OpenTelemetry metrics data model (opens in a new tab)
- Prometheus alerting rules (opens in a new tab)
- Prometheus instrumentation practices (opens in a new tab)
- Scrapy stats collection (opens in a new tab)
- JSON Schema validation specification (opens in a new tab)